Gain insights into your unstructured data to optimize storage costs and position data for success.
 Komprise is an unstructured data management SaaS solution with an analytics-first approach. What makes Komprise unique is that minutes after identifying shares, users can see key metrics on shares, directories and files – across data storage silos, whether they’re on-premises or in the cloud. This matters because without data insights, you’re shooting in the dark or simply treating all data the same.
That strategy (or lack thereof) leaves a lot of money and risks on the table. “You can’t do the right thing with data if you don’t know what you have,” notes Brett Sayles, a storage engineer with our customer, St. Luke’s Health.
Komprise Analysis provides consistent unified insights into your unstructured data across many vendors’ storage and cloud platforms. Key metrics include data volume, data growth rates, where data is stored, top owners, top file types and time of last access.
Komprise can create cost models using combinations of storage sources, targets and data tiering plans to identify ways to save money and achieve return on investment. Companies also use the metrics to create data lifecycle management policies for compliance and regulatory actions and reporting. Read more about unstructured data management policies.
Getting started analyzing unstructured data is easy:
- Komprise will provide an admin console as a part of the engagement;
- Configure Komprise Observer virtual machines close to the storage you wish to analyze;
- Identify NAS (network attached storage) file systems or object storage for analysis.
Below we share highlights of some of the metrics and charts you can see in the Komprise dashboard. For a deeper dive, download this white paper on Komprise Analysis.
Know First: The Komprise Analysis Plan Page
This view provides an overview of the status of the system, the number of files analyzed and their access time and more, which we call “the data donut”.
- The outer ring is made up of the data grouped by the last accessed time for selected shares. The different shades represent the different age date ranges. Red indicates hot data and dark blue indicates very cold data.
- The 3-Year Savings column, on the right, is an estimate of cost, capacity and backup capacity savings of moving infrequently accessed data to lower cost storage. These savings are based on the company’s own actual storage costs.
- Users can drill down into Data, Usage, Space, and Metrics tabs across All Shares or reduced to Specific Groups or Shares.

Customizing Date Ranges
Komprise lets you organize the age presentation to fit the topic at hand. There are options for as little as a week to as much as 15 years. Common uses are to see yearly growth or select dates to match the company’s backup or data retention policy.

File and Object Data Usage Analysis
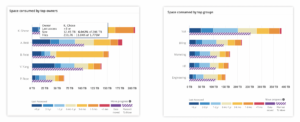
The Usage tab presents information by file type, file size, owners, groups, directories, and share– viewable by Size (Capacity) or Files (Number of Files). These summary tables are great for initiating conversations with departments and teams about their storage needs and requirements. Another benefit is with data management planning. Understanding file data characteristics can help determine a tiering strategy.
For example, start by tiering large files as they consume more expensive space. Organizations can avoid potential issues by knowing upfront the numbers of small files and how they impact data migration planning. Or, identify users with unusual data sets such as a lot of video files.

Unstructured Data Cost Modeling (FinOps)
Cost modeling in Komprise helps companies enter their actual storage costs to determine upfront new projected storage costs and benefits before spending money. Consider this question: How much does it cost to own your data?
Look at the storage platform. Does the company pay per GB (Opex) or is it an owned technology (Capex)? For the latter, divide the current total amount of actual usable data by the cost to acquire the full system to attain cost/TB. For example, 1PB of physical storage may end up being just 500TB of actual usable capacity but only has 300TB of actual useable data on it. Use the 300TB because that is representative of today’s data ownership cost.
Data ownership should also include the cost of data protection like backups and disaster recovery. Use the Cost Model tools to compare on-premise versus cloud models or factor in cloud tiering or adopting a new NAS platform.

Customers want baselines to make intelligent decisions for unstructured data management today and tomorrow. The Komprise Global File Index offers enhanced queries, data tagging, custom reporting and selective data movement with Deep Analytics and Deep Analytics Actions. For example, leverage Deep Analytics to find orphan data (also known as zombie data) and use Deep Analytics Actions to copy or delete it.
There’s a lot to learn about unstructured data using Komprise—and this is just a snapshot. See more charts and ideas in the comprehensive white paper on Komprise Analysis. You can also set a time with one of our unstructured data management specialists to discuss scheduling a custom Data Assessment.
Watch our customer success webinar for a detailed demo of the ways to use Komprise Analysis in your daily file and object unstructured data management decisions.
———-


